View HA Plugin Dashboard outside of App
Setting up sensors and status data in Home Assistant is a breeze. Download the Grafana & InfluxDB plugins and you'll be able to view and sift through the data with beautiful dashboards.
If you're like me, you view these graphs often. I tired quickly when having to open up the app click through the sidebar and click dashboard. All that to have the view smashed inside HA's UI.
Home Assistant Add-ons
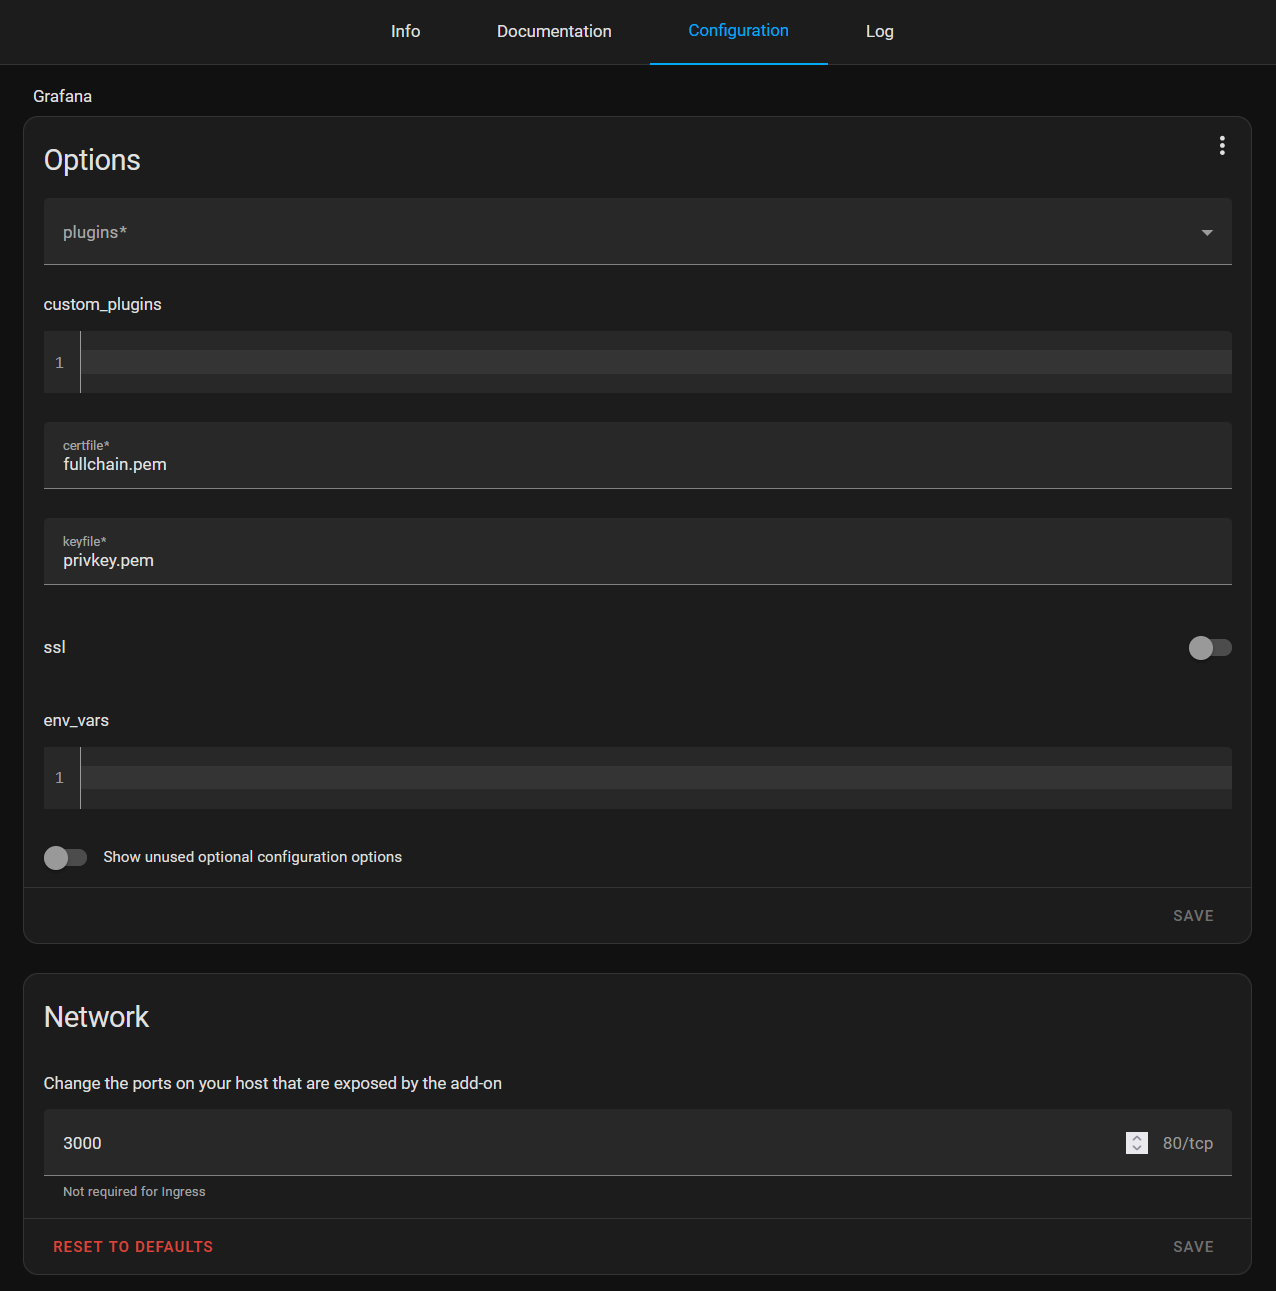
in the Grafana add-on settings, open port 3000 for docker. Just add 3000 to Network “Change the ports…” setting and save.
Before you leave HA
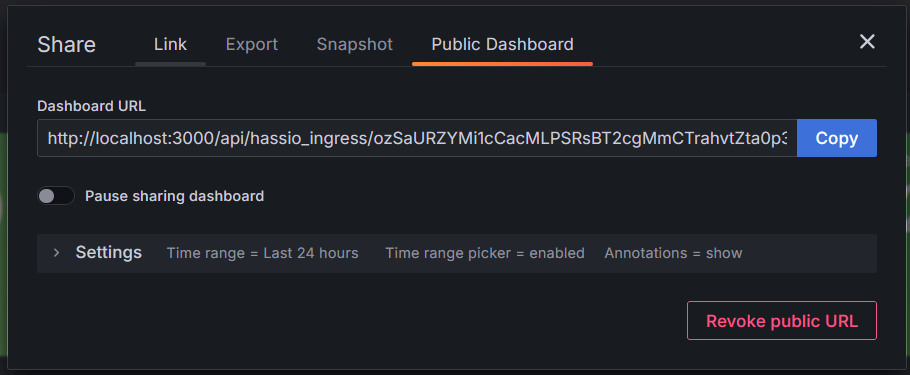
Head over the the Grafana add-on's view and find the Share button and copy the "Public Dashboard" URL
Browser
In the address bar make sure to change localhost to you HA's IP/Hostname
location = / {
  return 301 $forward_scheme://$host/api/hassio_ingress/ozSaURZYMi1cCacMLPSRsBT2cgMmCTrahvtZta0p3Y4/public-dashboards/404aa6b6300c40f9b9856a7ffebbbc82
}